Hammer Candlestick Pattern
What is a Hammer Candlestick?
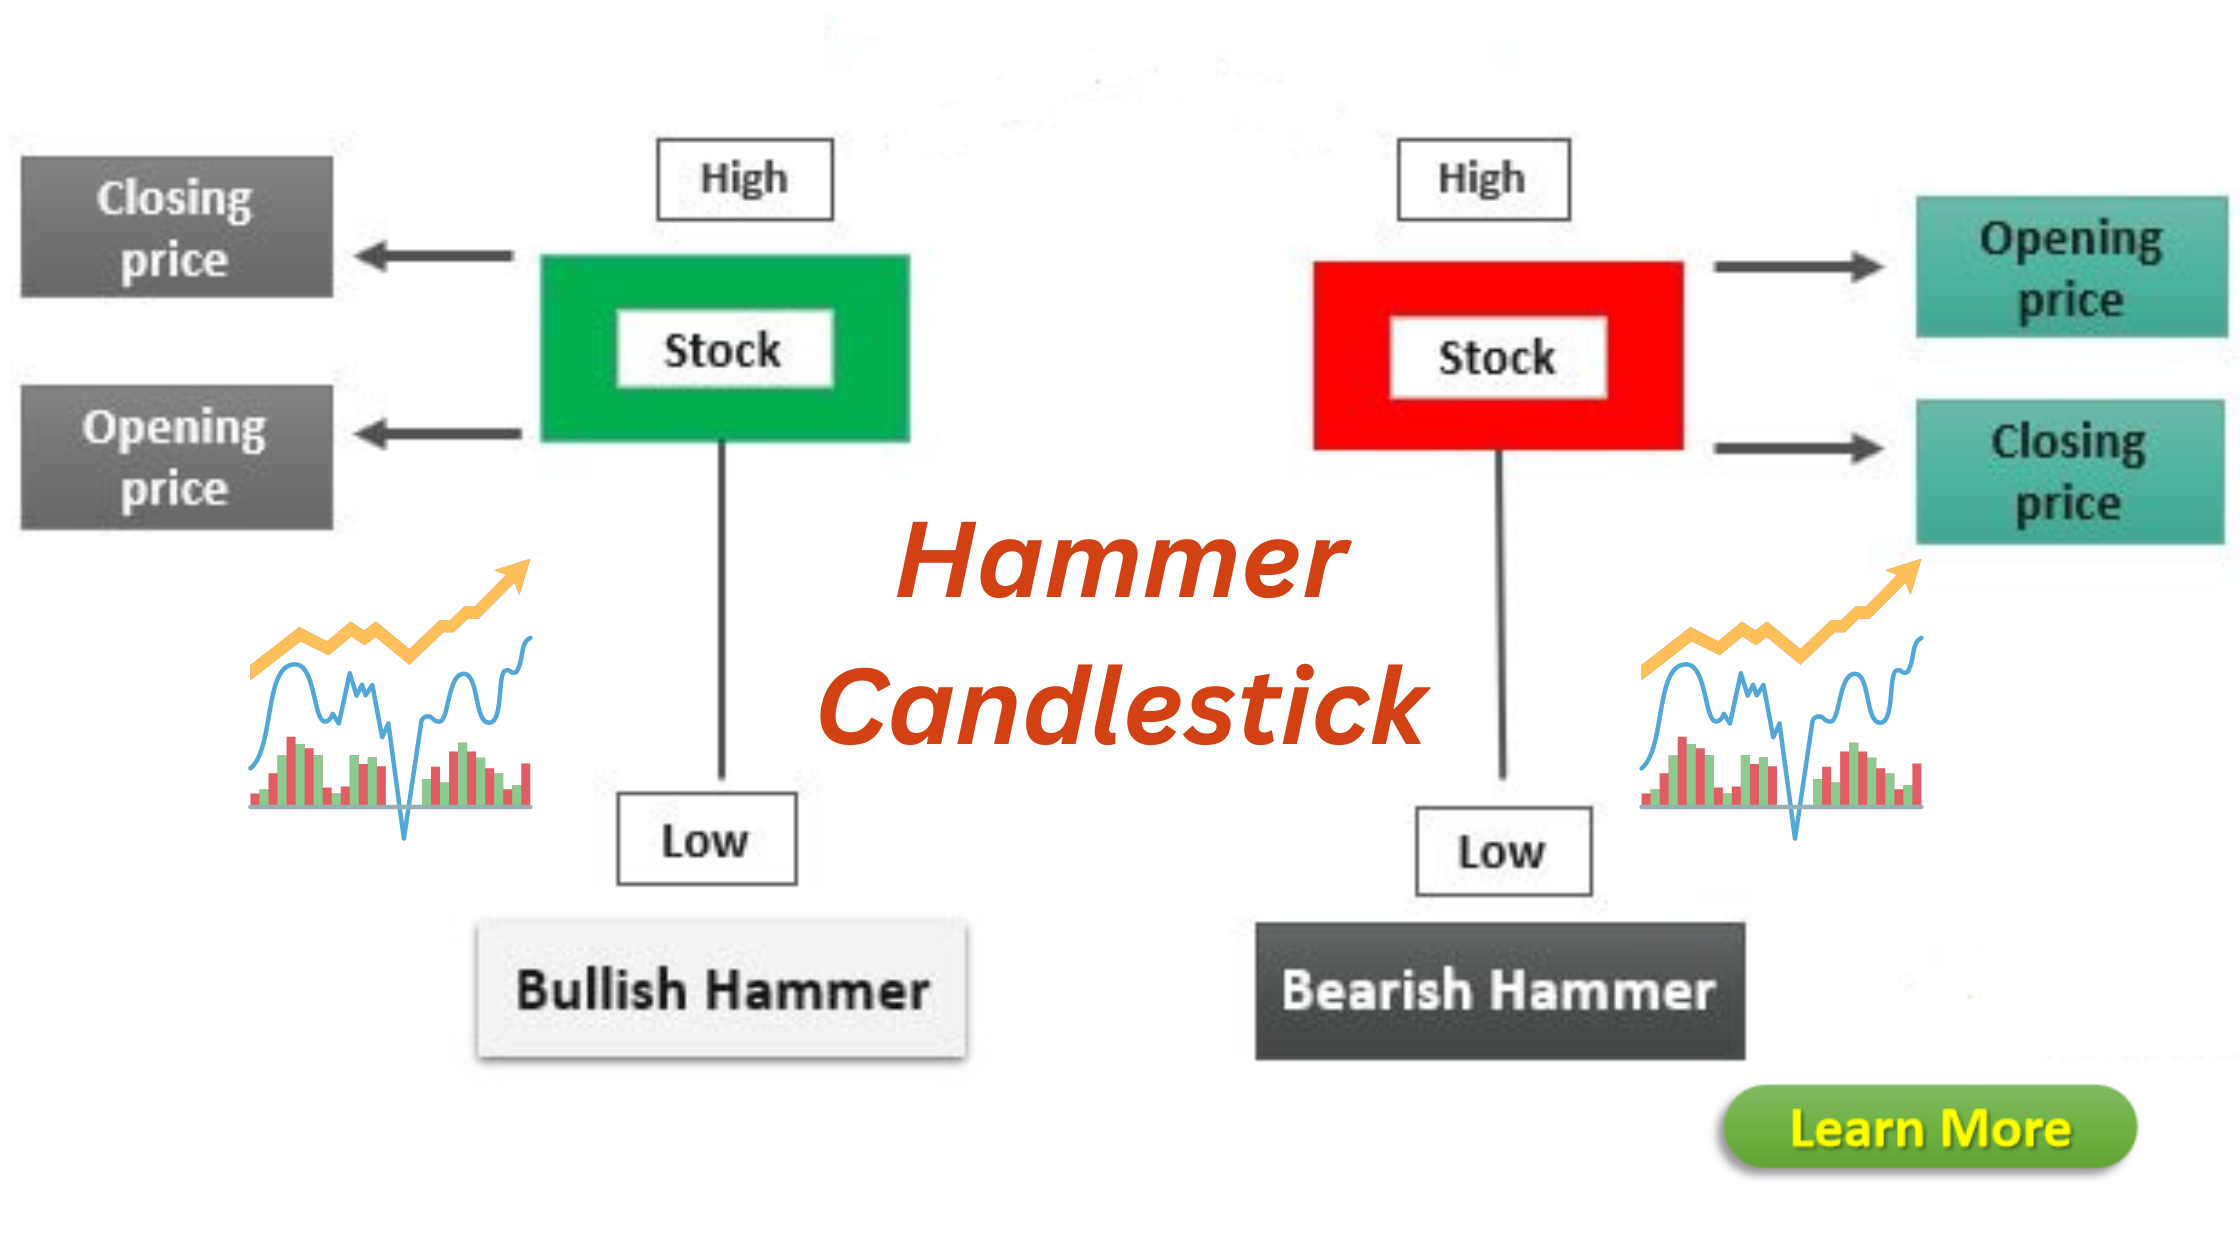
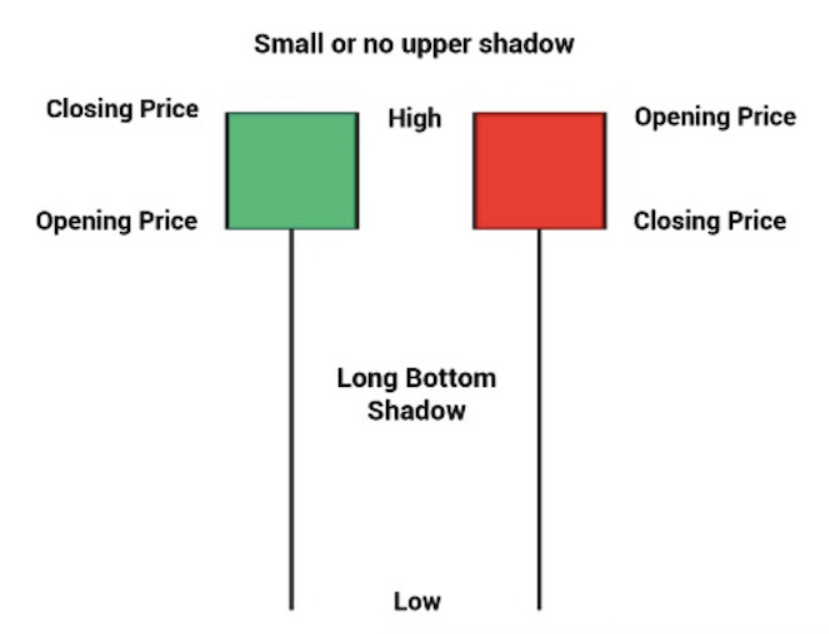
A hammer candlestick is a single candlestick pattern that often signals a reversal in a prevailing price trend. It is characterised by its distinct shape, which resembles a hammer, consisting of a short body located at the upper end of the candle’s range and a long lower wick. This formation suggests that buyers managed to push the price higher during the trading period, even after a significant downward movement. The long lower wick indicates that sellers attempted to drive the price down but were ultimately overwhelmed by buying pressure.
Trading Signal
In the world of financial markets and trading, various technical analysis tools play a crucial role in predicting price movements and making informed trading decisions. One such tool that has gained significant attention among traders is the hammer candlestick. In this article, we will delve into the intricacies of the hammer candlestick pattern, its formation, interpretation, and how traders can effectively incorporate it into their trading strategies.
Anatomy of a Hammer Candlestick
A hammer candlestick consists of several key components:
- Open: The price at which the candlestick opened.
- Close: The price at which the candlestick closed.
- High: The highest price reached during the trading period.
- Low: The lowest price reached during the trading period.
- Body: The coloured area between the open and close prices.
- Upper Wick: The portion extending from the top of the body to the high price.
- Lower Wick: The elongated portion extending from the bottom of the body to the low price.
Interpreting the Hammer Candlestick
The interpretation of a hammer candlestick depends on its context within the price chart. When it forms after a downtrend, it suggests potential bullish reversal. The long lower wick implies that sellers drove the price down significantly, but buyers managed to regain control and push the price up. This pattern signifies a shift in market sentiment from bearish to bullish.
In contrast, when a hammer candlestick forms after an uptrend, its interpretation may vary. It could signal a temporary reversal or a minor pullback before the prevailing uptrend resumes. Therefore, traders should consider the prevailing trend and other confirming indicators before making trading decisions based solely on the hammer pattern.
Types of Hammer Candlesticks
Bullish Hammer
The bullish hammer is a foundational hammer pattern that occurs after a downtrend. It indicates a potential trend reversal, and traders often look for confirmation from other indicators, such as trend lines or moving averages.
Inverted Hammer
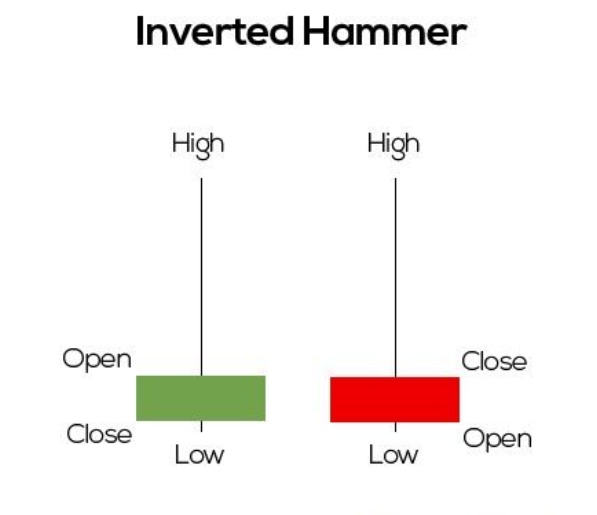
The inverted hammer, also known as a shooting star, is characterised by a long upper wick and a small body located near the low of the candle’s range. It typically occurs after an uptrend and could signal a bearish reversal. Confirmation is crucial when interpreting this pattern.
Shooting Star
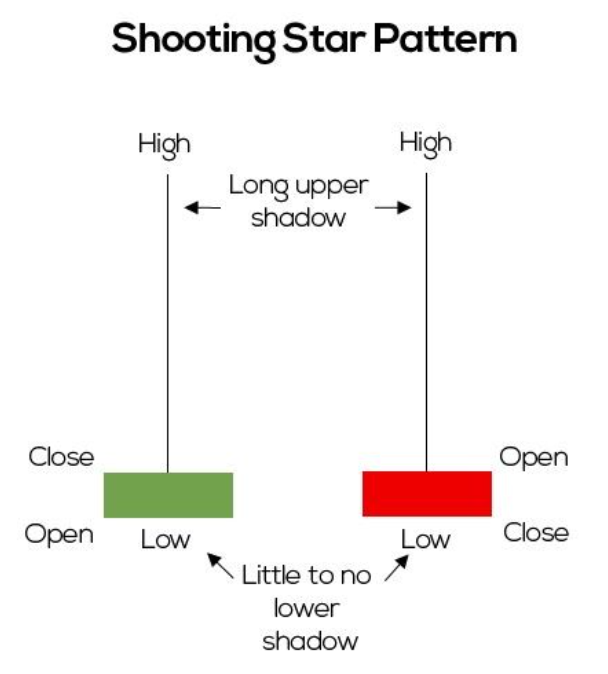
The shooting star is similar in appearance to the inverted hammer but forms after an uptrend. It suggests that despite an initial attempt by buyers to push the price higher, sellers gained control, leading to a potential reversal. Confirmation from other indicators is vital.
Psychology Behind the Hammer Candlestick
The psychology behind the hammer candlestick centres around the battle between buyers and sellers. The long lower wick represents the sellers’ dominance during the trading period, pushing the price down. However, the recovery seen in the latter part of the period signifies buyers stepping in, indicating a potential change in sentiment.
Identifying Hammer Patterns on Price Charts
Identifying hammer patterns requires a keen eye and an understanding of market context. Traders often use various timeframes and consider support and resistance levels to increase the accuracy of their observations.
- Timeframes and Accuracy : The accuracy of hammer patterns can vary across different timeframes. Longer timeframes, such as daily or weekly, tend to provide more reliable signals compared to shorter intraday timeframes.
- Support and Resistance Levels : Hammer patterns that form near key support levels enhance their significance. Similarly, if a hammer forms near a resistance-turned-support level, it strengthens the potential reversal signal.
Incorporating Hammer Patterns into Your Trading Strategy
Integrating hammer patterns into a trading strategy involves careful consideration and risk management.
- Confirmation from Other Indicators : While hammer patterns offer valuable insights, confirmation from other technical indicators, such as volume analysis or oscillators, can strengthen the reliability of the signal.
- Setting Stop-Loss and Take-Profit Levels : Establishing appropriate stop-loss and take-profit levels is crucial to manage risk. Placing a stop-loss below the hammer’s low can protect against potential false signals.
Real-Life Examples of Successful Trades Using Hammer Patterns
Let’s explore a couple of real-life scenarios where traders successfully utilised hammer patterns to make informed trading decisions.
- Example 1: Bullish Reversal in Stock XYZ : In the chart of stock XYZ, a bullish hammer pattern formed after a prolonged downtrend. Traders observed a surge in buying interest after the hammer’s formation, leading to a trend reversal.
- Example 2: Cryptocurrency BTC/USD : The BTC/USD chart displayed an inverted hammer pattern after a strong uptrend. Traders exercised caution due to the pattern’s location near a resistance-turned-support level and waited for additional confirmation before entering a trade.
Avoiding Pitfalls: Common Mistakes in Using Hammer Candlesticks
While hammer patterns can be powerful, traders should be aware of common mistakes that can lead to misinterpretation.
- Overlooking Market Context : Failing to consider the broader market context and relying solely on the hammer pattern can result in false signals.
- Ignoring Confirmation Signals : Relying solely on the hammer pattern without seeking confirmation from other indicators can lead to unsuccessful trades.
Combining Hammer Patterns with Other Strategies
Enhance the effectiveness of hammer patterns by combining them with other technical analysis tools.
- Trendlines and Moving Averages : Drawing trendlines and analyzing moving averages can help confirm the validity of hammer patterns.
- Fibonacci Retracement Levels : Using Fibonacci retracement levels alongside hammer patterns can provide additional insights into potential reversal zones.
Backtesting and Fine-Tuning Your Strategy
Before applying a trading strategy involving hammer patterns, it’s essential to backtest it on historical data and make necessary adjustments.
Hammer Candlestick in Cryptocurrency Trading
Hammer patterns are also prevalent in cryptocurrency trading. The principles of identification and interpretation remain the same, but traders should be aware of the volatile nature of the cryptocurrency market.
Pros and Cons of Using Hammer Candlesticks
Advantages
- Provides early signals of potential trend reversals.
- Offers insights into market sentiment shifts.
- Can be integrated with other technical analysis tools.
Limitations
- Requires confirmation from other indicators.
- False signals can occur in certain market conditions.
Conclusion
The hammer candlestick pattern is a versatile tool that traders can use to identify potential reversals in price trends. By understanding the formation, interpretation, and nuances of different types of hammer patterns, traders can enhance their decision-making process and improve their trading outcomes.
FAQs
Q1: Can a hammer candlestick pattern guarantee a profitable trade?
A1: No, a hammer pattern is a signal, not a guarantee. It should be confirmed by other indicators before making a trading decision.
Q2: What is the difference between a shooting star and an inverted hammer?
A2: Both patterns have similar appearances, but the shooting star forms after an uptrend and signals a potential reversal, while the inverted hammer forms after a downtrend.
Q3: Can hammer patterns be used in conjunction with fundamental analysis?
A3: Yes, combining technical analysis, including hammer patterns, with fundamental analysis can provide a more comprehensive view of the market.
Q4: Are hammer patterns equally effective in all financial markets?
A4: While hammer patterns can be effective in various markets, their reliability can vary based on market conditions and context.
Q5: How do I practice identifying hammer patterns?
A5: You can practice by studying historical price charts, using trading simulators, and analyzing real-time charts with a focus on hammer patterns.


1 thought on “Hammer Candlestick: A Comprehensive Guide to Understanding and Utilizing This Powerful 2023”